Developing documents(已废弃)
API Report Function Introduction
I. Function List
| No. | Name | Description |
|---|---|---|
| 1 | Traffic statistics | This function provides developers (such as ISVs) with statistics for various traffic indicators of online applications. |
| 2 | Application health | This function monitors health conditions of ISVs’ online applications. |
| 3 | Operation report | This function provides ISVs with the market conversion rate, financial data, and other data. |
| 4 | Monitoring and warning | This function provides ISVs with various monitoring configuration items and alarms. |
II. Detailed Sub-Function List
1. Traffic statistics
(1) General report
This report contains a trend chart of page traffic in the past 30 days, an application traffic report, and a visitor stickiness indicator report.
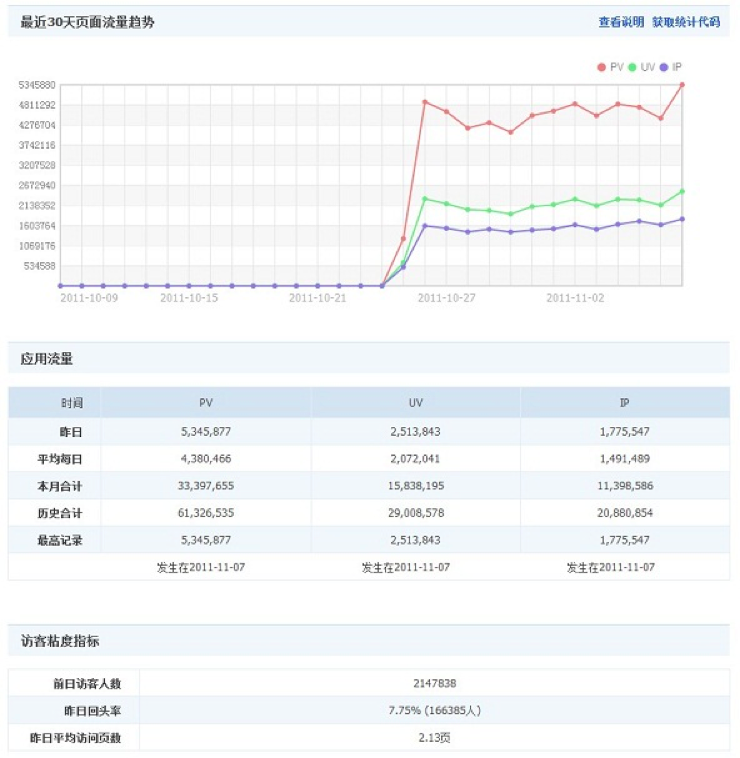
Page traffic trend in the past 30 days: analyzes the page view (PV), unique visitor (UV), and Internet Protocol (IP) data as well as data change trends in the past 30 days until the day before the current date.
Application traffic: provides an application’s PV, UV, and IP data in the following periods and aspects: yesterday, daily average, monthly total, historical total, highest record, and time of the highest record. Where,
- Daily average: Total data volume accumulated from the first day when data was generated/Duration (in units of days) of data statistics. The deadline of data statistics is the day before the current date.
- Historical total: refers to the total data volume of an item (PV, UV, or IP) accumulated from the first day when data was generated for the current application.
- Visitor stickiness indicator: provides the user stickiness data of yesterday, including the number of visitors, return visit rate, and average number of visited pages.
- Return visit rate of yesterday: Number of the same visitors who visited yesterday and the day before yesterday/Number of visitors who visited the day before yesterday
- Average number of visited pages yesterday: PV data of yesterday/UV data of yesterday
(2) Period analysis
This report contains a trend chart and a report of hourly traffic on a single day, as well as a comparison of hourly traffic in multiple days.
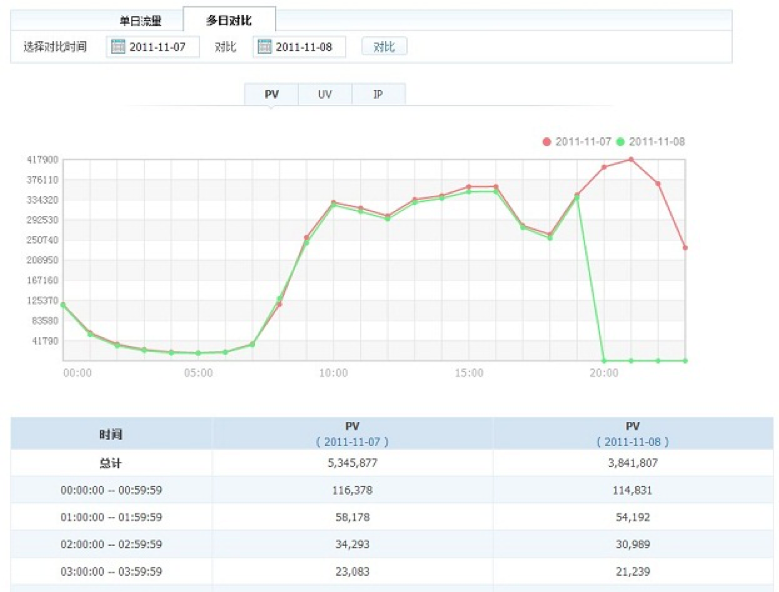
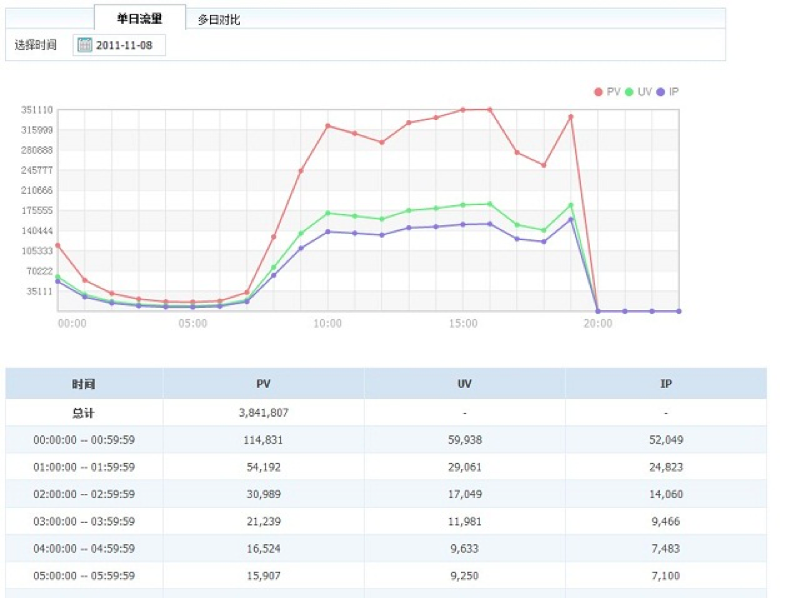
Period analysis: analyzes the PV, UV, and IP data as well as data change trends within 24 hours on a date specified by the inquirer. There are two functions: one-day traffic and multi-day comparison. Where,
- One-day traffic: displays the PV, UV, and IP data as well as data changes within each hour in a day.
- Multi-day comparison: displays a comparison of PV, UV, and IP data changes on an hourly basis between two specified dates.
(3) Daily analysis
This report contains a trend chart and a report of daily traffic within a specified period, as well as the number of returning visitors and average number of visited pages.
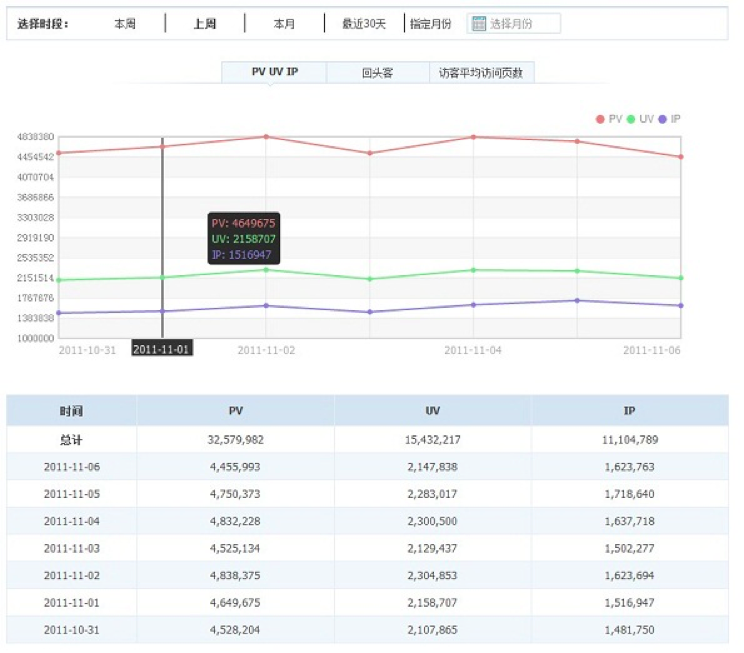
Daily analysis: provides the daily traffic and user behavior of user visits for an application this week, last week, this month, in the past 30 days, and in a specified month. The data includes the PV, UV, and IP data, the number of returning visitors, and the average number of visited pages. Where,
- Number of returning visitors: refers to the number of the same visitors who visited on the current date and the day before the current date.
- Average number of visited pages: Daily PV data/Daily UV data
(4) Visited page analysis
This report contains a pie chart of visited page traffic and a trend chart of specified visited page traffic within a specified period.
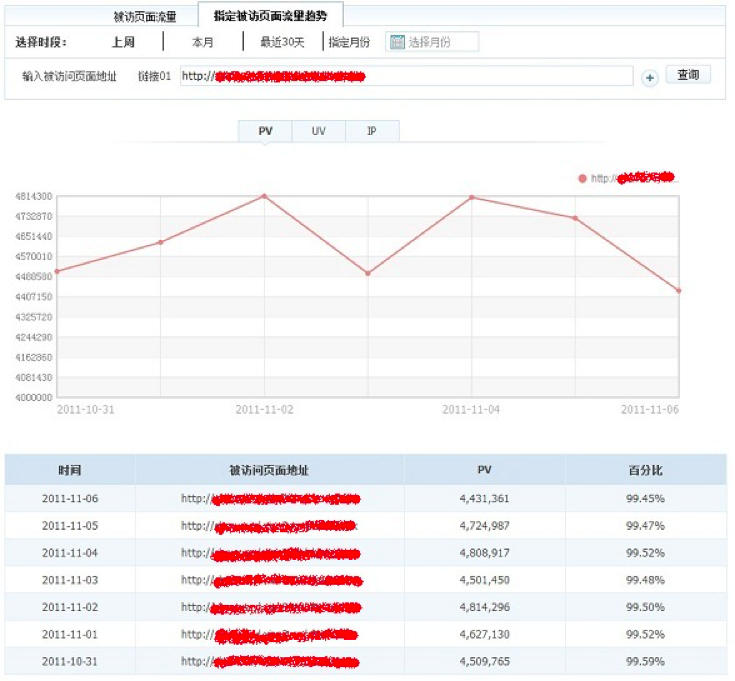
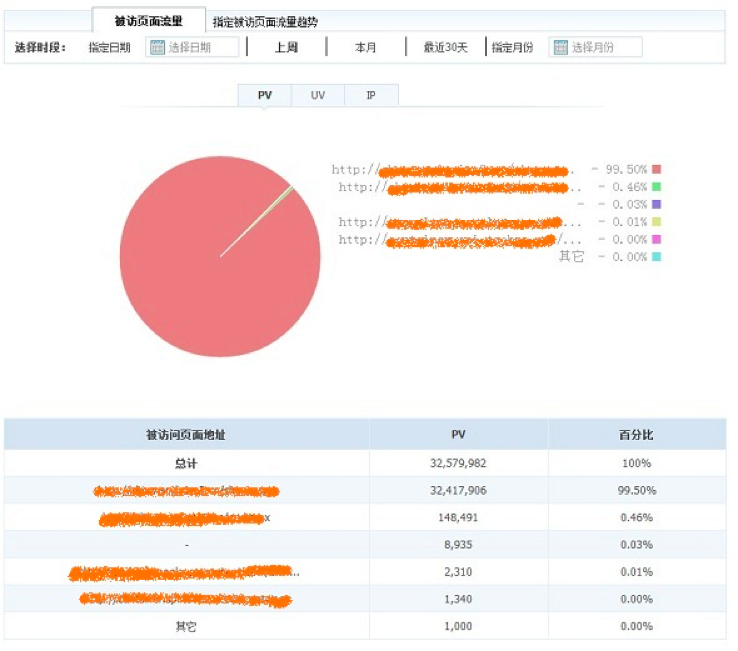
Visited page analysis: provides traffic and trends of visited pages for an application on a specified date, last week, this month, in the past 30 days, and in a specified month.
The data includes traffic of visited pages and traffic trends of specified visited pages. Where,
- Traffic of visited pages: displays traffic percentages of visited pages for an application in a pie chart and traffic rankings in descending order. Currently, the report displays only the top five pages one by one, and uses Others to display the total data volume of other pages.
- Traffic trends of specified visited pages: displays data change trends within a specified period for a visited page specified based on the URL entered by the inquirer. A maximum of three visited pages can be queried at the same time.
(5) Visiting area analysis
This report contains a pie chart of visiting area traffic and a trend chart of specified visiting area traffic within a specified period.
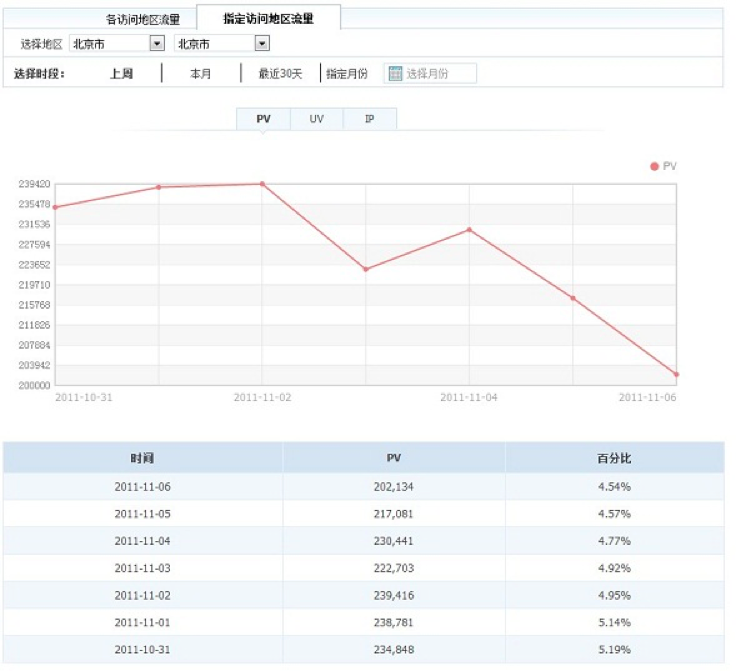
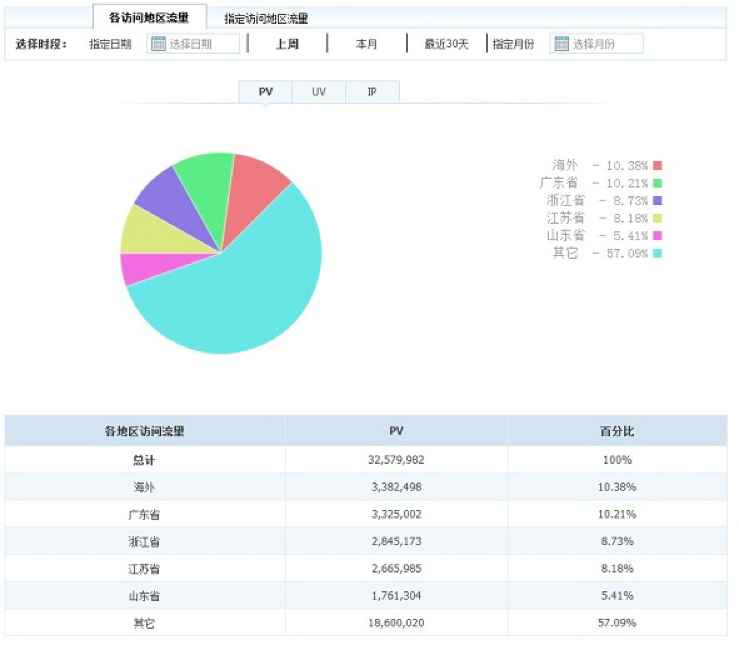
Visiting area analysis: analyzes and extracts user behavior data for visitors coming from different areas to further assess the user quality and value in different areas. The data can be queried based on a specified date, last week, this month, the past 30 days, and a specified month. The data includes traffic of various visiting areas and traffic trends of specified visiting areas. Where,
- Traffic of various visiting areas: displays traffic percentages of various visiting areas in a pie chart and traffic rankings in descending order. The data covers various provinces, autonomous regions, direct-controlled municipalities, and special administrative regions in China, as well as overseas areas. Currently, the report displays only the top five areas one by one, and uses Others to display the total data volume of other areas.
- Traffic trends of specified visiting areas: displays traffic trends within different periods for a specified area (accurate to the city).
2. Application health
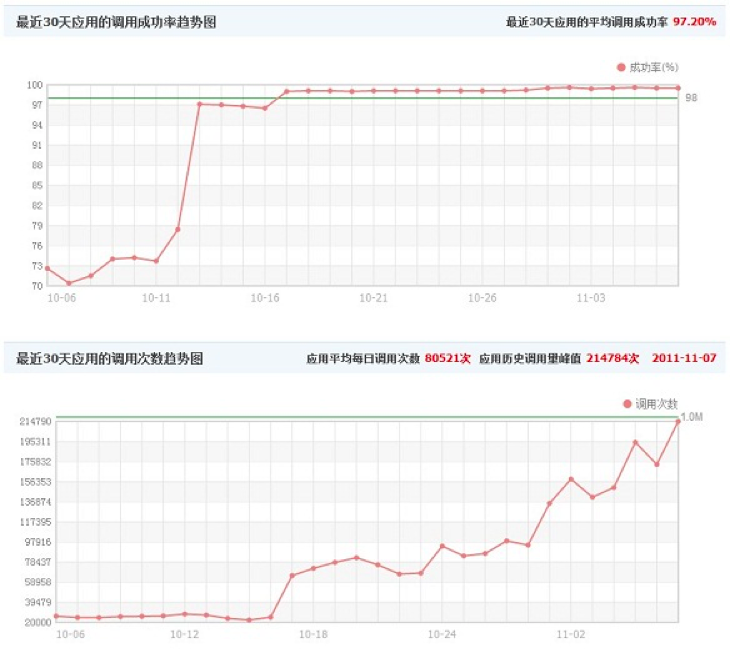
(1) API invocation success rate
This report contains trend charts of an application’s API invocation success rate and API invocation quantity in the past 30 days.
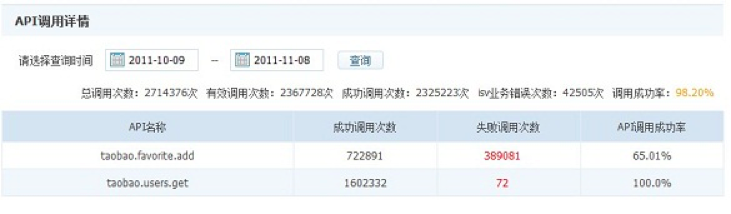
(2) API invocation details
This report contains detailed information about API invocation.
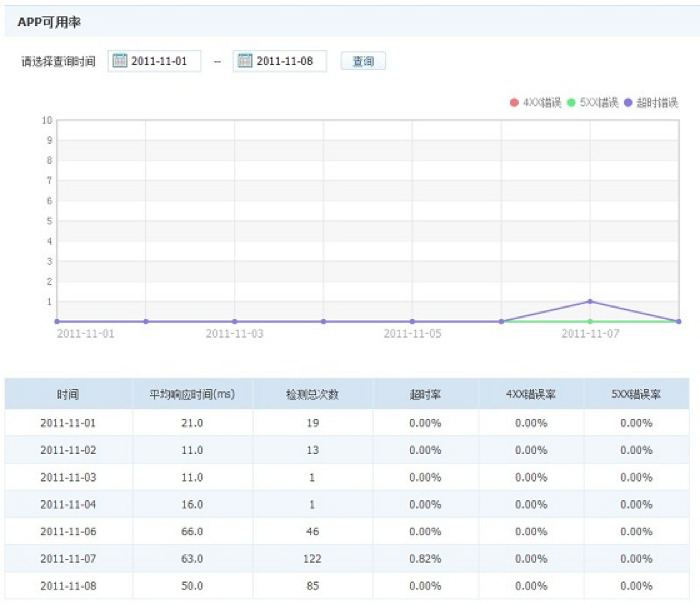
(3) Application availability ratio
This report contains a curve chart and a report of 4XX errors, 5XX errors, and timeout errors.
3. Operation report
(1) Revenue sharing report
(2) Order history query
(3) Purchase relationship query
4. Monitoring and warning
Application stability problems usually occur on the application server, including:
- (1) The server breaks down.
- (2) The web server stops providing services.
- (3) The machine is heavily loaded.
- (4) The network is faulty in the equipment room.
- …
If the preceding problems occur, the relevant application cannot be accessed properly, which will seriously affect user experience. To resolve such problems, the simplest solution is to enable the AliExpress open platform (which is developed based on the TOP) to monitor the system status on the application server. In this manner, the TOP is able to detect stability problems on the server in a timely manner and report alarms to the developer, facilitating further response, maintenance, and processing.
The TOP provides the configuration of the following four alarms:
- (1) Application success rate
- (2) API traffic
- (3) Application availability ratio
- (4) Application response time
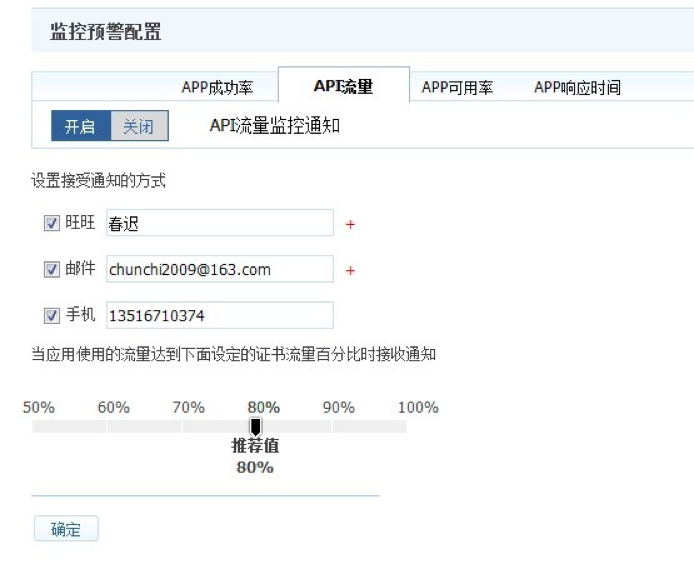
If the value of any alarm type exceeds the specified threshold, the TOP will report an alarm based on the alarming mode preconfigured by the developer.
